Catch that Millionth Download with Bintray’s New Statistics API
UPDATE: As of May 1, 2021 Bintray services will no longer be available (ConanCenter and JCenter are not affected) for more information read the Centers Deprecation Blog
Want to know exactly how many times your packages have been downloaded? Bintray has always given you download statistics through its UI, but now you can also get them for professional repositories via REST API. Detailed statistics on downloads per version over any time frame give you deep insights into how your software releases are consumed.
If you have never used statistics in Bintray, go ahead and check it out in the user guide.
Let’s see an example
Say I want to get the daily number of downloads of ‘myCoolPackage’ from October 1st to October 8th, 2015. This is what the stats look like in the Bintray UI:
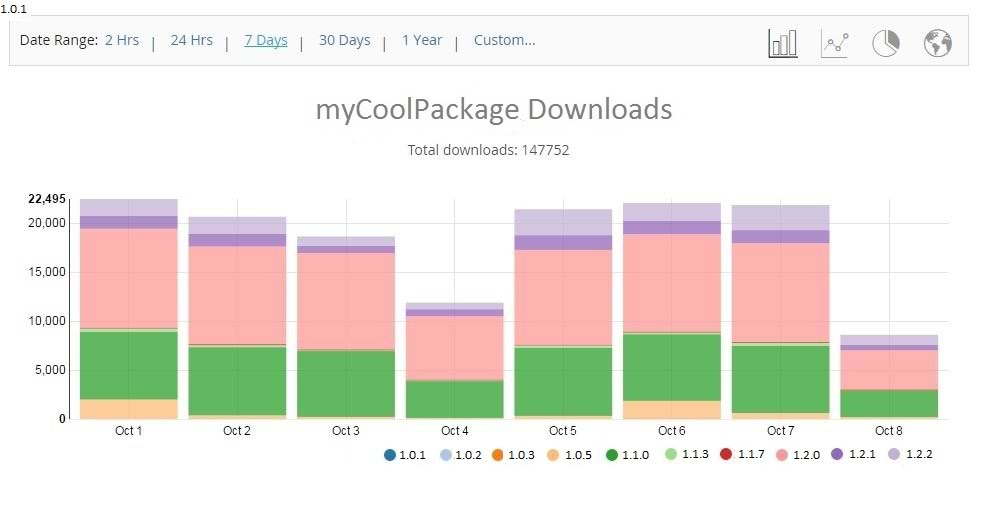
According to the chart, ‘myCoolPackage’ was downloaded a total of 147,752 times in that period. We can clearly see that there were downloads every day; there were dips on October 4th (Sunday) and October 8th (the chart was generated on October 8th around midday), and the most popular versions were 1.1.0 and 1.2.0.
Now you can get all this information programmatically using the new REST API. Here’s the “daily downloads” API as it is described in the REST API documentation:
GET /packages/:subject/:repo/:package/stats/time_range_downloads
To get the statistics displayed in the chart above, I would use the following command:
curl -X GET "https://api.bintray.com/packages/tamarUser/Maven/myCoolPackage/stats/time_range_downloads" -u tamarUser:***my-top-secret-api-key*** -H "content-type:application/json" -d “{\"from\":\"2015-10-01T12:08:56.235z\",\"to\":\"2015-10-08T12:08:56.235z\"}"
I get the following response in JSON format:
{
  "from":"2015-10-01T00:00:00.000Z",
  "to":"2015-10-08T23:59:59.999Z",
  "records":[
      {"date":"2015-10-01","downloads":
        [{"version":"1.0.5","count":1939},
         {"version":"1.1.0","count":6950},
         {"version":"1.1.3","count":293},
         {"version":"1.1.7","count":116},
         {"version":"1.2.0","count":10111},
         {"version":"1.2.1","count":1329},
         {"version":"1.2.2","count":1706}]},
      {"date":"2015-10-02","downloads":
        [{"version":"1.0.5","count":315},
         {"version":"1.1.0","count":6975},
         {"version":"1.1.3","count":198},
         {"version":"1.1.7","count":121},
         {"version":"1.2.0","count":9967},
         {"version":"1.2.1","count":1290},
         {"version":"1.2.2","count":1759}]},
      {"date":"2015-10-03","downloads":
      ...]
}
The response provides all of the same data that Bintray uses to create the chart in the UI. For each day within the requested date range in which downloads occurred, it lists the number of downloads per version. As simple JSON output, you can easily parse the response and use it any way that helps you analyze your package downloads quickly and effectively. You are now able to identify trends in downloads, your popular versions and more.
Other statistics REST APIs include: total downloads and downloads by country. Keep an eye on this blog to hear about new APIs when we add them.
Good luck!


